Dashboard
Introduction
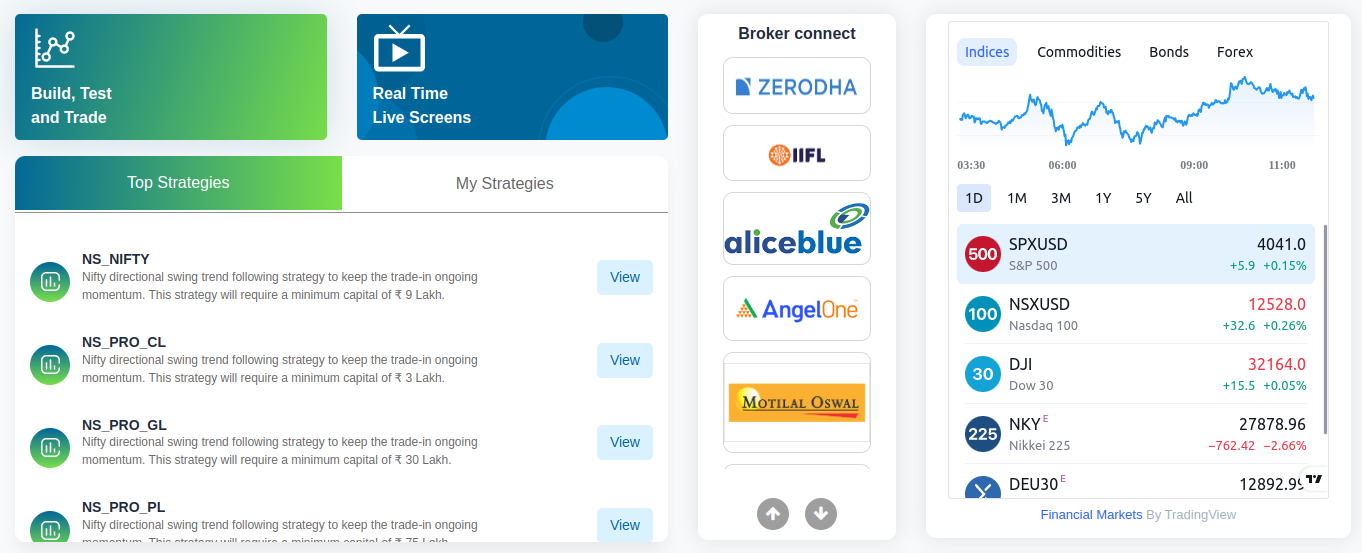
The Qodrr Dashboard shows you a glimpse of some top strategies and the strategies created by you, the broker connect option and a look at real-time screens of different financial markets.
Clock
The clock shows the current date and time according to the Indian Standard Time (IST). The trading hours in India are 9:15 am - 3:30 pm, for the stock market, and it is available till 11:30 pm for the Commodities market where you can buy, sell and invest.

Build, Test and Trade
Through this feature, you can create strategies that cater to your needs through which you can trade in real-time and earn profits.
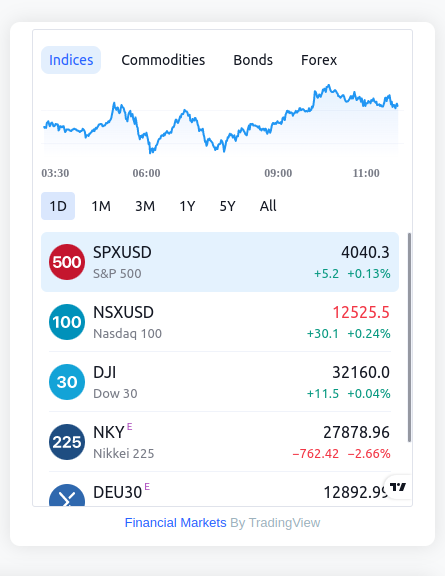
Real-Time Live Screens
This feature shows you a glimpse of live stock screeners for different financial asset classes such as indices, bonds, forex, and commodities. Here, you can view different stock screeners such as the Convergence Screener, the RSI Screener, etc.

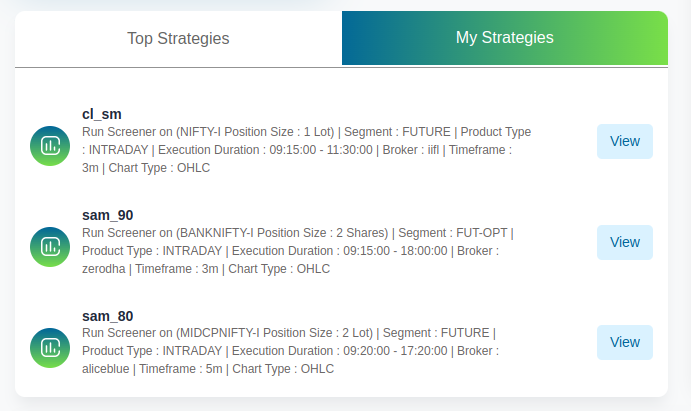
Top Strategies
This part of the dashboard shows you some of the top strategies which are custom created by our experts with a lot of research and market experience. These strategies are tried and tested and are gone through thorough and rigorous testing in the market. You can also subscribe to these strategies on a monthly, quarterly, half-yearly, or yearly basis.
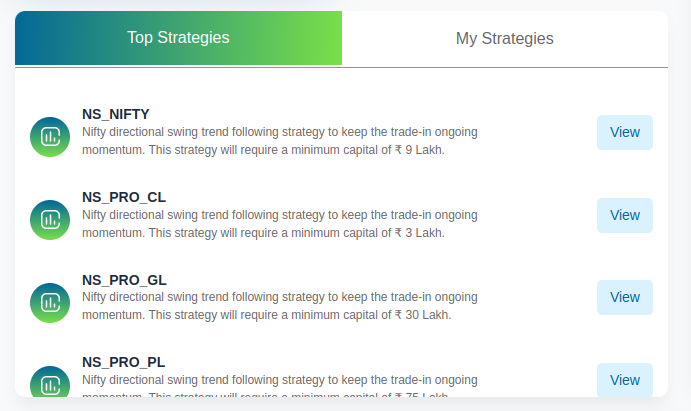
My Strategies
Here, you can check out all the strategies you have created up until now and know its summary.
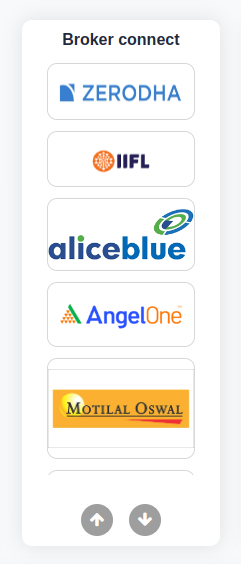
Broker Connect
With this feature, you can add your broker(s) to your Qodrr Account. It is necessary to add your broking details to begin trading with Qodrr. You need to provide information like your username and password or your API Key, API Secret, and Trading Link, depending on your broker.
Financial markets
Over here, you can have a look at some of the financial market's top trading stocks in Indices, Commodities, Bonds, and Forex Markets.
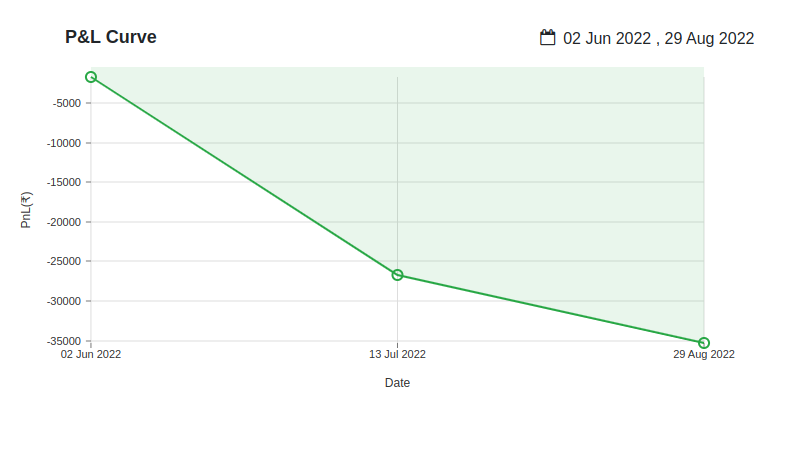
PnL Curve
In this section of the dashboard, you can view your cumulative Profit and Loss status through a graph.
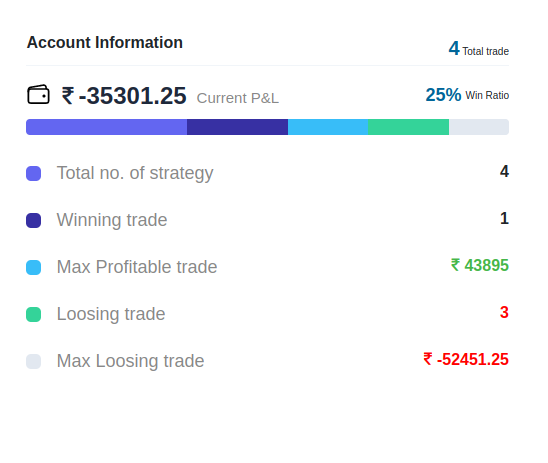
Account Information
In this section, you can view your account information which shows your winning and losing trades, max profitable and losing trades, the total number of strategies, and your current profit and loss.