Indicator Configuration
Technical Indicators in stock market are mathametical formulas or pattern, which derives peforming analysis on security historical price, volume and other factors. Such technical indicators are widly used to generate BUY/SELL signal on any security's data points.
Follow this page to understand the usage and configuration of different indicators supported on Qodrr platform.
Information
Below are the different indicators supported by Qodrr platform.In-case you have any request to integrate a indicator, which is not available yet on our platform. you can contact to our support team for the same.
- Comparator - Select Compartor for using technical indicator's value for trading decision making.
- Crosess - Price Point crossess indicator value to generate BUY/ SELL Signal
- Crossover - A Poit of place, where indicator values crossing each other. Eg: 5 SMA crossing 10 SMA.
- Above/Below - Price Point Above/Below the indicator value to generate BUY/ SELL Signal. Eg: BUY below RSI 30 and SELL above RSI 70.
Important
Our platform support Buy and Sell conditions with in the same strategy plan. Eg: Generate a BUY/SELL signal on 5 & 10 SMA crossover or BUY when RSI crosses above 60 and SELL crosses below 40. You can get more information on different indicators usage on indicator configuration page. Below attributes help to define BUY and SELL trigger points with different formula usages.
- Long Param - Formula value to be considered for BUY(Long) signal condition
- Short Param - Formula value to be considered for SELL(Short) signal condition
Technical Indicators
Technical indicators are mathematical calculations based on the price, volume, or open interest of a security or contract used by traders who follow technical analysis.
-
ADX/DMS
The Average Directional Movement Index (ADX) is used to measure the strength of a trend in the market. It is an average of expanding price range values and is a component of the Directional Movement System (DMS).
Note
After applying the ADX/DMS indicator, you need to specify details like Period and smoothing period. Our platform will generate BUY/SELL signal based on a positive and negative ADX value covergence.

-
Aroon
The Aroon indicator measures the time between highs and time between lows over a period. When the Aroon Up is above the Aroon Down, it indicates bullish price behavior, and when the Aroon Down is above the Aroon Up, it signals bearish price behavior.
Note
After applying the Aroon indicator, you need to specify details like Period. Our platform will generate BUY/SELL signal based on a positive and negative Aroon value covergence.

-
Bollinger Bands
Bollinger Bands are defined by a set of trendlines plotted two standard deviations (positively and negatively) away from a simple moving average (SMA) of a security's price, which can be adjusted to user preferences.
Note
After applying Bollinger Bands, you need to fill in the details like the period and the standard deviation. Our platform will generate BUY/SELL singal on price crossing on Bollinger band median line.

-
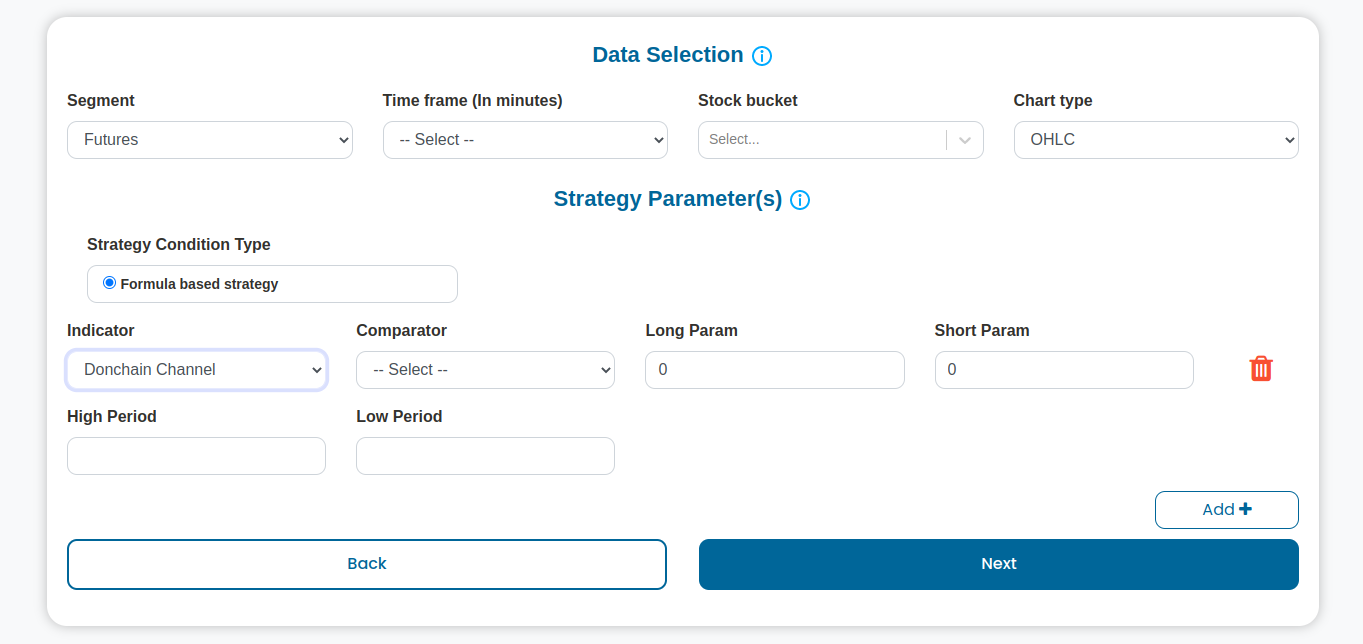
Donchian Channel
Donchian Channels are three lines generated by moving average calculations that comprise an indicator formed by upper and lower bands around a midrange or median band.
Note
After applying the Donchian Channel, you need to fill in the details like the high and low period. Our platform will generate BUY/SELL singal on price crossing on Donchian Channel median line.
-
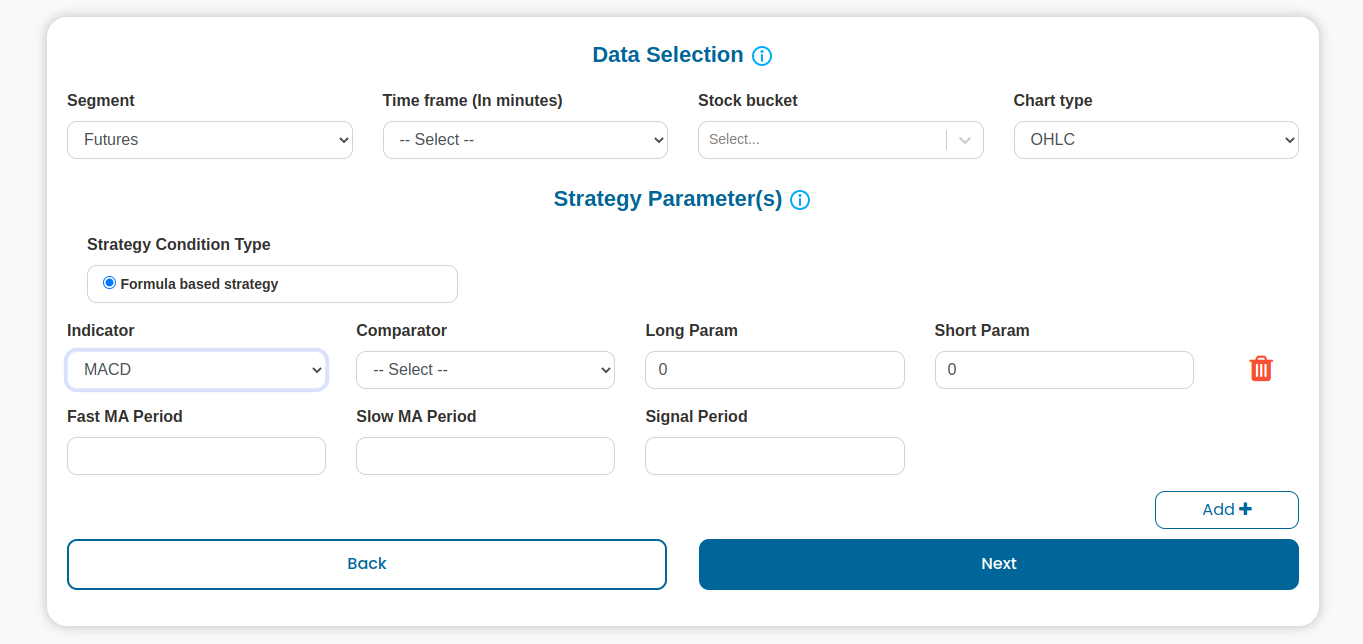
Moving Average Convergence Divergence (MACD)
The MACD indicator is a momentum oscillator primarily used to trade trends. It appears on the chart as two lines that oscillate without boundaries.
Note
After applying the MACD, you need to fill in details like fast and slow MA period, and the signal period. Our platform will generate BUY/SELL signal based on a MACD and Signal line value covergence.
-
Stochastic
The stochastic oscillator, also known as the Stochastic Indicator, is a popular trading indicator that is useful for predicting trend reversals. It also focuses on price momentum and can be used to identify overbought and oversold levels.
Note
After applying the Stochastic Indicator, you need to fill in details like fast and slow %K period, and the slow %D period. Our platform will generate BUY/SELL signal based on a Fast and Slow Stochastic line value covergence.

-
Super Trend
A Super Trend is plotted on price and the current trend that can simply be determined by its placement vis-a-vis price. It is a very simple indicator and is constructed with the help of just two parameters- period and multiplier.
Note
After applying the Super Trend, you need to fill in details like period, and multiplier. Our platform will generate BUY/SELL signal based on super trend signal.

-
Relative Strength Index (RSI)
The Relative Strength Indicator (RSI) measures the speed and magnitude of a security's recent price changes to evaluate overvalued or undervalued conditions in the price of that security.
Note
After applying the Relative Strength Index (RSI), you need to fill in details like period. Our platform will generate BUY/SELL signal based on RSI value and comaparator used.

-
Moving Average (MA)
A Moving Average (MA) smooths out price trends by filtering out the noise from random short-term price fluctuations.Our platform supports 3 type of moving averages available from which you can select one.
-
Simple Moving Average A Simple Moving Average (SMA) calculates the average of a selected range of prices, usually closing prices, by the number of periods in that range.
-
Exponential Moving Average The Exponential Moving Average (EMA) places a greater weight and significance on the most recent data points.
-
Double Exponential Moving Average The Double Exponential Moving Average (DEMA) is used to identify a potential uptrend or downtrend in the price of a stock or other asset.
Note
After applying the Moving Average (MA), you need to fill in details like comparators,the type of moving average, and its value. Our platform will generate BUY/SELL signal based on Moving Average value and comaparator used.

-
-
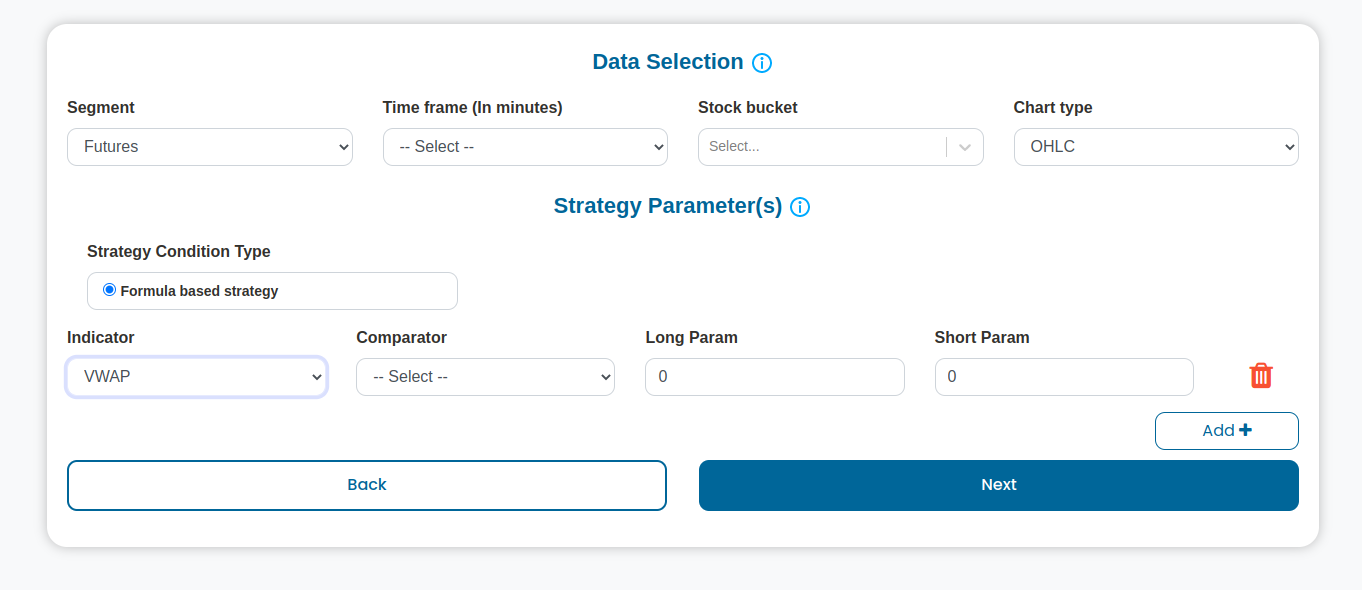
Volume Weighted Average Price (VWAP)
The Volume Weighted Average Price (VWAP) is a technical analysis indicator used on intraday charts. It represents the average price a particular security has traded at throughout the day, based on volume and price.
Note
After applying the Volume-Weighted Average Price (VWAP), Our platform will generate BUY/SELL signal based on VWAP crossing pricing point.